Microsoft Global Skills Initiative

Microsoft launched a global skills initiative to provide digital training to 25 million global workers.  The online courses will be delivered through Microsoft, LinkedIn, and GitHub.  

A new “System of Learning” app will be released later this year on Microsoft Teams.

“Increasingly, one of the key steps needed to foster a safe and successful economic recovery is expanded access to the digital skills needed to fill new jobs.  And one of the keys to a genuinely inclusive recovery are programs to provide easier access to digital skills for people hardest hit by job losses, including those with lower incomes, women, and underrepresented minorities.”

Microsoft President Brad Smith

The Microsoft Data Science team leveraged the LinkedIn Economic Graph to estimate global digital job growth over the next half-decade.  Microsoft estimates that by 2025, there will be 100 million new software development positions, 20 million cloud and data roles, 20 million data analysis, machine learning, and AI jobs, and 10 million cybersecurity, privacy, and trust roles.

LinkedIn has already setup digital training tracks for ten of these key positions: Software Developer, Sales Rep, Project Manager, IT Administrator, Customer Service Specialist, Digital Marketing Specialist, IT Support / Help Desk, Data Analyst, Financial Analyst, and Graphic Designer.  These roles were selected as they have “the greatest number of job openings, have had steady growth over the past four years, pay a livable wage, and require skills that can be learned online.”
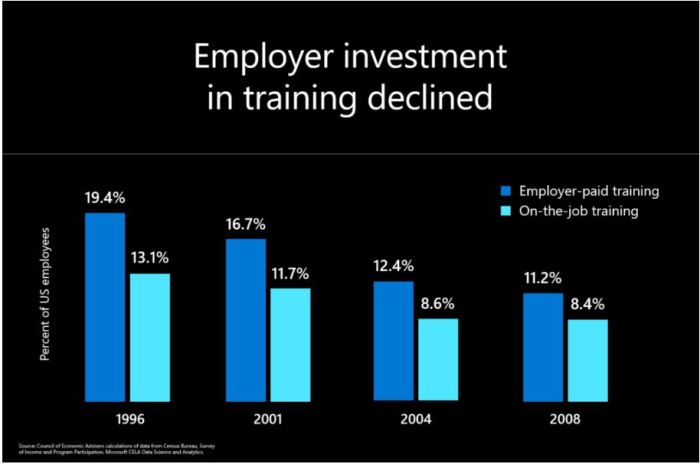
Microsoft noted that investment in employee training has declined over the past few decades, leaving fewer employees with on-the-job or employer paid training benefits. Since 2008, investment has remained flat.

“Exacerbating the challenge is the fact that existing training is not reaching the populations who need it most. On-the-job training far outpaces distance learning and other alternative modes, limiting options for prospective employees. Perhaps more significantly, on-the-job training is more than two times as prevalent among workers who are already in higher-skilled roles, leaving those in more automatable positions even more vulnerable to displacement.”

Microsoft President Brad Smith

Emphasis on Virtual Training

The availability of low cost or free training tools is one of the silver linings from the pandemic. Boardroom Insiders, a profiler of C-level biographies and executive concerns, spent two weeks reviewing recent CIO interviews. They observed that technology leaders have emphasized upskilling and reskilling their teams to address skills gaps while working from home.  Tech vendors have rolled out “a whole host of free training and education programs.”  As these programs are virtual, CIOs are encouraging their staff to attend these sessions with zero travel costs and reduced or waived registration fees.

Likewise, CIOs are using the time at home to hone their leadership, communication, and team engagement skills.  CIOs have found their teams to be more productive, collaborative, and agile, with rising morale.

HubSpot Sales & Marketing COVID Activity Metrics

HubSpot has measured aggregated sales and marketing platform activity across its 70,000 customers since the pandemic began and benchmarking this activity against the pre-COVID level (January through early March).  Looking back at Q2, CMO Kipp Bodnar noted that “the data shows steady and sustained growth in buyer engagement, and that businesses with an online presence were ready to capture that interest.”

Marketing teams have risen to the challenge of keeping prospects interested in a messy, chaotic crisis and met an audience of buyers who suddenly spend all day at their computer,” commented Bodnar.  “While email volume has risen significantly — typically a no-no for teams hoping to keep their open rates up — open rates have risen faster than volume has grown, demonstrating that teams have been successful at providing relevant and helpful content.”

Marketing email open rates are up ten to twenty percent above pre-COVID levels, with the last week of June running 18% above the baseline.

Sales teams have been less successful in their outbound communications.  While sales emails have risen 60% since mid-March, “response rates have been dismal. Marketing teams have been able to connect, but sales teams haven’t. This is a huge area of opportunity for businesses as they enter the next quarter of COVID-19.”

Sales email open rates are down 25 to 30%.  “As sales teams increased email sends, customers began to tune these messages out or even mark them as spam in their inboxes,” warned Bodnar.  “So far, it seems if email send rates remain this high, we can expect response rates to trend in the opposite direction.”

“Volume and quality is a tradeoff — the time a team saves by sending out email blasts is wasted if that outreach isn’t personalized, relevant, and helpful. These gaps are clear in the data. At this point, sales teams should be working closely with marketing to understand how they can improve their email engagement rates, and sending far less email.”

HubSpot CMO Kipp Bodnar

Website traffic increased during the pandemic as decisionmakers and influencers began working from home.  Global site traffic is up 16% in Q2 vs. Q1 with it peaking at 24% above the benchmark on April 20th.  Software industry site traffic is running at 40% above pre-pandemic levels.

Customer-initiated chat levels have also risen sharply during the pandemic.  Total volume is up 31% over the pre-pandemic baseline, with every measured industry seeing increased volume.  “Sales teams have pivoted to chat to grow their pipelines, while customer service teams are leveraging this medium to manage the increased demand for support,” observed Bodnar.

Call prospecting has dropped significantly during the pandemic as it has become more difficult to reach individuals who are now working at home.  Call prospecting fell as much as 27% below baseline the week of April 6th and now is down around 9%.  Before COVID, there was a rough balance between phone and email prospecting, but in Q2, email activity doubled that of phone calls.  “Sales teams will need to return to their pre-COVID balance in order to see improvements in response rates,” argued Bodnar.

Deal Creation has improved in eight of the eleven weeks since April 6th, with deal creation up the past four weeks.  APAC deal creation was down 5% in Q2, North America down 6%, EMEA down 12%, and LATAM down 12%.  Large companies have recovered deal creation activity faster than small firms.  Computer Software deal creation was down 3% in Q2.

Deal Won has improved ten of the last eleven weeks, after dropping to 36% below baseline the week of April 6th.  For the full quarter, deals won were down 11%.  Smaller firms did best at closing deals, with larger firms posting the weakest performance, likely due to large firms selling a greater percentage of high-dollar, strategic deals that would have stalled in their pipeline.  Computer software Q2 was 14% above baseline, but this probably overstates industry performance due to Q1 often being the slowest month of the year and the loss of many “hockey stick” end of quarter deals at the end of Q1 as the pandemic struck.  Some of these likely slipped into Q2.

Bodnar provided three suggestions for Q3: invest in chat, shift from quantity to quality in sales prospecting and communications, and invest in online discoverability.

Global Database V2 Launched (Part II)

Yesterday I began my discussion of Global Database’s v2 sales and marketing intelligence solution.


Global Database supports a proprietary industry taxonomy along with country-specific SIC codes.  European NACE codes are on the roadmap.

Screening is straightforward with a broad set of selection criteria:

  • Companies: Employees, Trading Activity (Import/Export Flags), Activity Type (Distributor, Producer, Service Provider), Active Status, Incorporation Date Range, Legal Form
  • Executives: Seniority (7 levels), Department (29), Job Title
  • Industry: The Global Database industry taxonomy and 11 European industry codes, but no US SIC, NAICS, or NACE  
  • Location: Country, Region, City or State, ZIP
  • Financials: Turnover, Net Profit, Total Liabilities, Directors Remuneration, Profit per Employee, Exports, Currency
  • Digital Insights: Website Monthly Visits, Used Technologies (web-mined), Alexa Ranking
  • Advanced: Have Email Address, Have Telephone, Have Fax, Have URL, Have VAT, Have a Company Registration Number, Have Business Address, Have Lat/Long, Have Direct Email Address, Have Direct Dial, Contacts Recently Updated (this month, three months, six months)

The report list shows 50 companies at a time.  Users may download the list as a custom CSV file.  They also can quickly add, remove, or sort displayed columns.

As each variable is selected, Global Database automatically updates the company and contact counts.  Users may save both companies and search criteria.

Company lookups may be performed by company name, registration number, VAT Number, URL, and Phone Number.  Unfortunately, Tickers are not available, and companies are not sorted by size, making it challenging to locate the headquarters of large multi-nationals or global publics (quoted companies).  

Contacts may be looked up by name.

As a V1 UI release, there are some bugs.  For example, the Company Structure for multi-nationals with many subsidiaries appears without any viewable details unless the user realizes she can pinch and expand the display for a partial view of the tree.  The user can click on a node to view the name and ownership type, but other details are only visible by clicking through to the profile.  This display makes the ownership research process cumbersome and random.  Likewise, the officers’ view displays both active and resigned directors and corporate secretaries but does not display all active directors at the top of the report.

While it is easy to quibble with V1 UI issues, there are also some well-designed features.  The design has a mobile-ready layout with icons along the left-sidebar.  It also retains the most recent search criteria when the user clicks on the magnifying glass, search icon.  This feature allows the user to drill down to research specific companies without losing the search criteria or being forced to open multiple browser tabs.  Below the selection criteria are the most recently viewed companies.  

A tenders database search is a feature not generally available in sales intelligence services.

The option to request editorial research for accounts by function and role, with rapid turnaround, is a differentiator.

The new UI does not yet support Salesforce, but it is available on its legacy platform.  Salesforce integration is planned for Q3.  Other planned enhancements include credit reports for 40 countries and a News and Activity tab scheduled for Q4.

The service begins at £5,000 for a single-country, single-user license with the global edition priced at £30,000 for five users.  Additional seats are priced at £500.

Clients include Amazon, Uber, Getty Images, Leadfeeder, Telepass Italia, and The Economist. Buldumac indicated that business has increased during the pandemic as firms look for more clients, require tools for assessing business risk, and source digital sales and marketing solutions in the absence of event marketing.

Global Database V2 Launched

Global Database refreshed its sales and marketing intelligence platform with a new user interface, list upload enrichment, and financial-change triggers.  The mobile-ready design supports list building and export, peer lists, group structure (linkage) display, European registry data, and Companies House filings.

Other new features include the ability to

  • Export only certain data types
  • Pay directly online for users that have reached their download limits
  • Add multiple applications, such as sales and marketing, credit risk, and funding modules.

Global Database supports sales, marketing, credit risk, and onboarding use cases.  Data is gathered through licensing, mining, and editorial research.  An enrichment feature lets firms identify companies for which they require additional contacts by role and level.  The twenty-person research team then identifies the contacts.  Global Database has a one-hour turnaround on individual contact requests and a 24-hour turnaround for larger volume requests.

Global Database covers 70 million companies, 47 million of which are active.  Inactive companies are supported for compliance and data hygiene use cases.  44 million contacts are available, of which 10 million have emails, and 25 million have switchboard phones.  In the UK, both trading and registered addresses are provided.

All contacts are GDPR compliant based upon a “Legitimate Interest” basis for data collection.  Emails are verified every six months.  Global Database did not disclose their company data sources for publication, but the core European vendors are long-standing, well-respected sources of registry and credit data.

“Unlike other data providers, Global Database is focused on listing only official government data, that have a registration number and a company status (active or inactive).  This will give a complete overview of the addressable market that a company can target.  Very often, companies rely on LinkedIn and other data providers and, in return, they missed many opportunities.”

Global Database CEO Nicolae Buldumac

The database is weighted towards Europe, with 39 million active companies and 34 million employees.  Regional coverage is as follows:

RegionCompaniesContacts
Europe39 million34 million
North America (US/CAN)1.1 million4.8 million
Latin America3.2 million1.3 million
Caribbean19,00030,000
Asia (includes ANZ)1.5 million2.1 million
Middle East270,000640,000
Africa900,000900,000
Grand Totals47 million44 million
Global Database Counts by Region

Company profile depth varies by country, with European firms enjoying the most detail.  The overview page contains firmographics, contact information, a Google Map for the Registered Address, a multi-paragraph, mined business description, Turnover and Net Asset graphs (up to 20 years), five employees, summary web traffic and technologies, and the most recent company updates.

The Financials tab displays key values and ratios values, including mini-five year bar graphs for quickly assessing the data.  Reports include the P&L, Balance Sheet, Cashflow, Capital & Reserves, Miscellaneous Indicators, and KPIs and Ratios.  UK Registered filings are available as PDFs for the UK with image data for forty other countries in development.

The Credit tab provides risk analysts with overall credit risk, a recommended credit limit, mortgages, and county court judgments.

The Employees tab displays executives lists and directors’ profiles.  Users may export the executives list as a CSV file and perform social searches for LinkedIn, Twitter, and Facebook.

The Ownership tab provides shareholders, a graphical group structure, and the latest ownership activity.

The Location tab displays registered and trading addresses with Google maps.

The Competitors tab provides a peer list based upon the largest three peers by SIC code.  The list is exportable to CSV, and users may change the competitors.

The Digital Insights tab helps users research the company’s web presence and deployed web technologies.  Up to five years of website traffic are graphed.  Other content includes a six-month visitor count, Alexa Rank, SimilarWeb score, traffic sources (direct, organic, referral), top organic keywords, top referral partners, traffic by countries, web technologies in use, WHOIS website owner, and WHOIS server details.

Users may set up alerts for financial data changes (i.e. when a company reports a threshold percentage increase or decrease in revenue, number of employees, or EBITDA) as well as new filings and address, director, ownership, and group structure change.

The database supports a broad set of prospecting variables spanning firmographics, biographics, technographics, and financials.  Selects are displayed on the left, and results are dynamically updated as each variable is submitted.  Users can quickly update the results list layout by adding and removing, sorting, and filtering columns.  Results may be downloaded as a CSV file.  Salesforce uploads are targeted for the Q3 release.

Global Database supports a proprietary industry taxonomy along with country-specific SIC codes.  European NACE codes are on the roadmap.


Continue to Part II.