MarTech Supply and Demand Analysis from Frans Riemersma
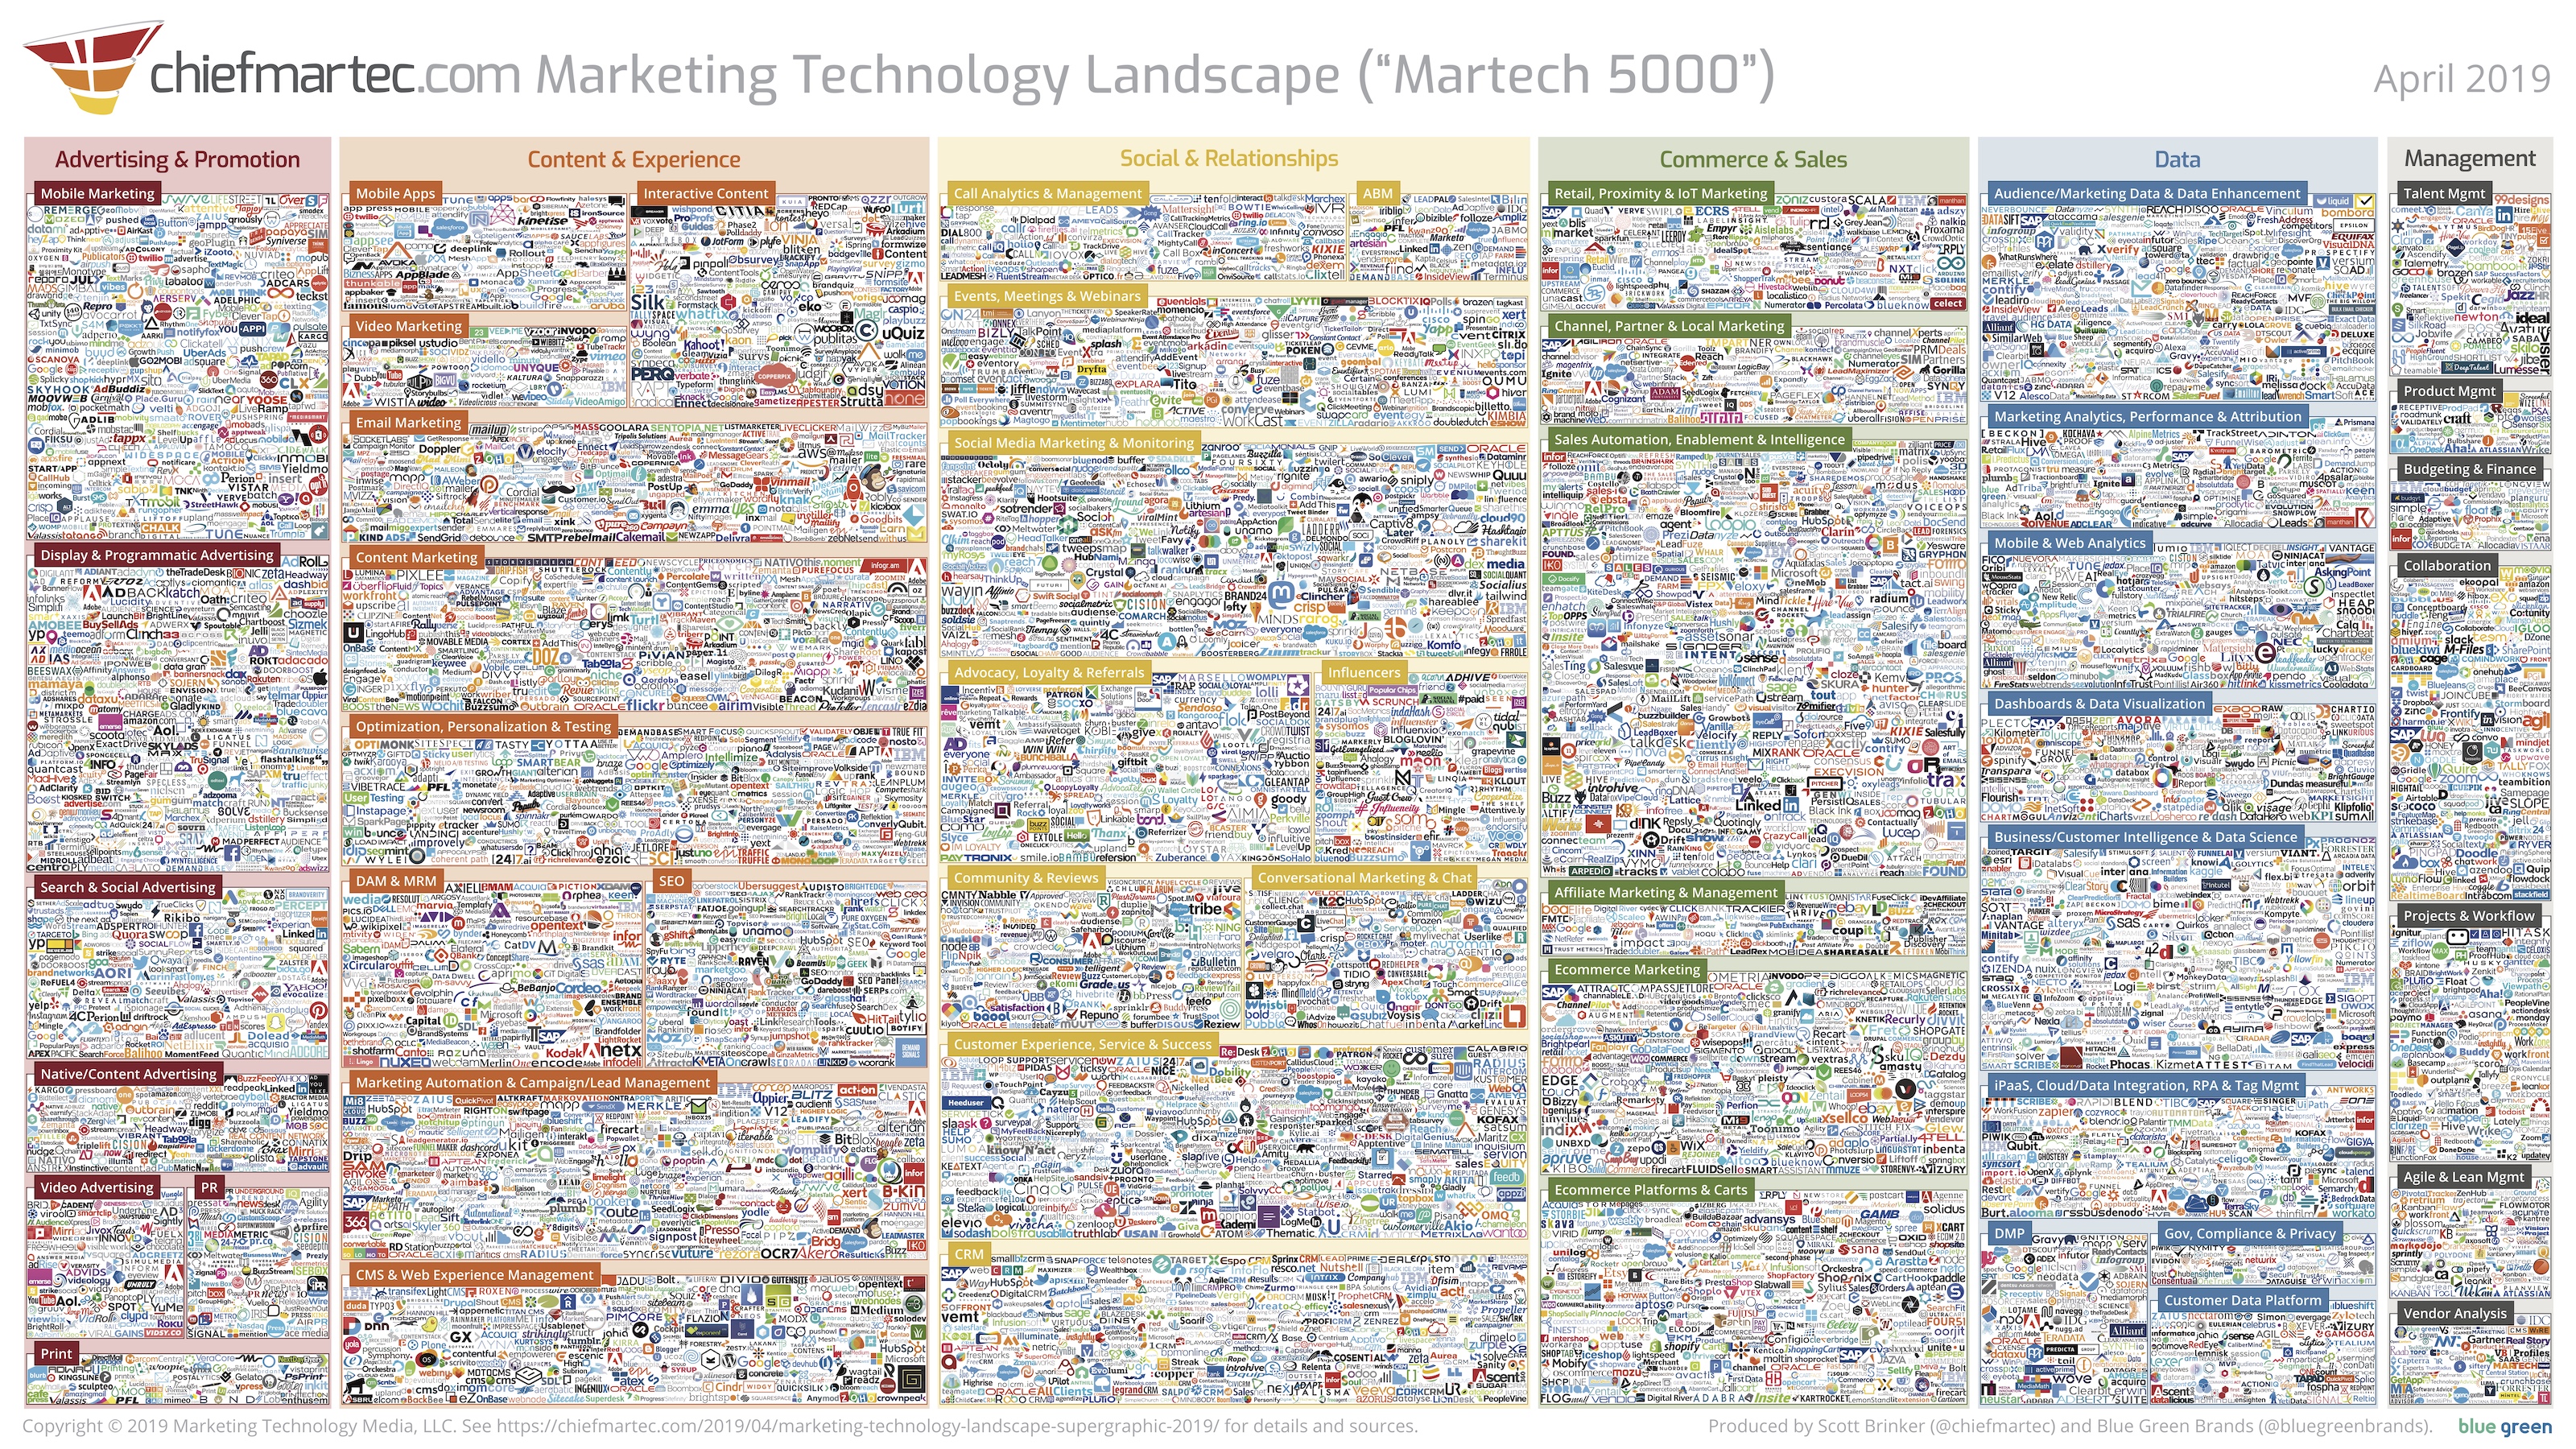
After I wrote about the revised 2022 MarTech Landscape, Frans Riemersma, who helped Scott Brinker update the MarTech Landscape, shared an analysis of supply and demand among various MarTech categories. The light shading represents the “demand” side of MarTech, as captured in the frequency by which apps appear in 718 tech stacks. The dark shading represents the “supply” side of MarTech in a particular category, as represented in the MarTech Landscape.
According to their analysis, MarTech “Monopolies” exist where there is significantly more demand than supply (technically, they are oligopolies). Segments marked by many buyers and few suppliers include Social & Search Advertising, ABM, and Mobile & Web analytics.
Conversely, MarTech competition exists in segments with more vendors than demand. Competitive segments include Mobile Marketing, Live Chats & Chatbots, and eCommerce Platforms & Carts.
Riemersma identified niches as segments with a low number of suppliers and limited demand. Niche segments include Native/Content advertising, Video Marketing, Marketing Analytics, and Performance & Attribution.
The new MarTech Landscape is available as a searchable database.
Scott Brinker and Frans Riemersma published the first update to the MarTech Landscape in two years. The latest edition, which covers 9,932 solutions, is up 24% since 2020. While 12% of the 2020 vendors (972) have either been acquired or no longer operate, another 2,904 have been added.
Brinker noted that while acquisitions continue apace, they have not resulted in industry consolidation as large players support partner ecosystems that foster new entrants:
“The irony of platform consolidation in MarTech — and cloud software more generally — is that it drives the development of more specialist and custom apps.
Consolidated platforms reduce the choices of which ones developers should build on to reach the largest possible audience. This is the dynamic with Apple and Android that has resulted in millions of mobile apps. It’s a virtuous cycle, as the more apps built on a platform further increase that platform’s strength — attracting even more developers to build on it.
Consolidated platforms also tend to be quite stable, both technically and as businesses that are likely to be around for years to come. They often win on cost economies of scale and breadth of functionality. This further drives that virtuous cycle of attracting more apps to be built on their foundation.
App platforms also play a special role in facilitating the success of specialist apps by making them more discoverable for customers in their domain through app marketplaces. The more plug-and-play an app can be on their platform, the easier it is to adopt — which further enables more specialist apps to be successful within their ecosystem.”
The MarTech space continues its rapid growth, with nearly 10,000 solutions in 2022.
As the logos have been reduced to favicons, the data is now available on a free, interactive site called martechmap.com. Users can mouse over any favicon to view a mini-profile with links to the company website and CabinetM profiles. Users can search, sort, filter, and create custom PDFs. They can also filter by keyword and vendor’s HQ country.
“The massive scale and rapid rate of change of the MarTech industry and the wealth of solutions within it was no longer well-served by a once-a-year, static graphic,” blogged Brinker. “It’s a point in time, which is interesting to see year-over-year. But we want this community resource to be something that is updated on a more continuous basis. By now producing the graphic algorithmically, it’s easy to release updates in a matter of minutes — versus the dark ages of hand-placing little logos manually on a slide.”
By segment, the management group grew the fastest (67%) and the data segment had the slowest growth (7%):
Advertising & Promotion: 16%
Content & Experience: 34%
Social & Relationships: 17%
Commerce & Sales: 24%
Data: 7%
Management: 67%
“The growth in management tools is likely a result of marketing teams operating their day-to-day work in an ever more digital fashion — including greater support for remote work,” posited Brinker and Riemersma in their “State of MarTech 2022” report.
The MarTech Landscape database is in beta, so expect performance issues. As it is an online database vs. a static list, I would recommend that vendors confirm that their products are properly displayed, including acquisitions, products that have changed names, and recently launched offerings. For example, the ABM category is missing several vendors. Changes can be submitted via the Contribute tab.
With the pandemic and recession, the sales intelligence and B2B data space held up well. Most of the vendors I speak with indicate an increasing demand for sales and marketing intelligence and B2B DaaS offerings. In January and February, I’ll be reporting on those numbers.
As part of my annual trends analysis, I put together a list of the top events and trends in our space this year:
COVID: Sales & Marketing Intelligence continued to grow during the pandemic as sales and marketing needed to pivot to new verticals, reach the buying team working from home, and double down on segments that benefited from or had limited impact from the pandemic.
Dun & Bradstreet: $DNB was taken public 18 months after being taken private. The firm has regained some swagger through acquisitions. They began the year with Orb Intelligence (firmographics) and closed it with Bisnode (Central European partner). Dun & Bradstreet also launched several new B2B S&M offerings (D&B Intent, D&B Connect, D&B ABM, D&B Analytics) and expanded its contact acquisition process with the Outlook-based D&B Email IQ.
Intent Data: Intent data has become the hottest content set in the B2B space as firms move to integrate multiple categories of intent within sales and marketing workflows. Zoominfo, Dun & Bradstreet, and TechTarget all enhanced or announced integrated intent data offerings with custom models. TechTarget’s acquisition of BrightTALK and Spiceworks Ziff Davis of Aberdeen are also partially motivated by intent datasets.
European Vendors: The European market is growing rapidly, with UK vendors extending their services across the EU (e.g., Global Database, Rhetorik) and Continental vendors entering the UK (e.g., Echobot, Vainu).
Consolidation: Market consolidation stalled in H1, but by Q4, there were weekly M&A announcements with several other deals rumored to be in the works in Q1.
Spiceworks Ziff Davis: SWZD acquired Aberdeen, positioning it as a competitor in both intent data and technographics. Spiceworks Ziff Davis has the potential to copy TechTarget’s model.
My Trends Analysis runs over 100 slides. It includes a 90-minute phone consult and is available for purchase.
Boardroom Insiders CEO Sharon Gillenwater discussed the top of mind issues for CIOs due to the pandemic. Initially, the CIOs’ focus was on transitioning to work from home along with tightened security. There were also “stepped up initiatives around cloud, automation, and e-commerce in order to keep the business running. In fact, COVID-19 did more to speed up their digital transformation plans than anything else in recent history.”
“You can’t speed up the culture of an organization. You can roll out technology maybe faster… You have to be careful about speed over perfection. Speed is one thing, but you have to make sure that you don’t introduce any security risks, so it’s sort of combining those two things together [that] I think is extremely important at this time.”
Box CIO Paul Chapman
The Boardroom Insiders research team spent two weeks reviewing recent CIO interviews and identified five positive by-products of the pandemic that are improving the resiliency and capabilities of the enterprise. First off, tech leaders have emphasized upskilling and reskilling their teams to address skills gaps. Tech vendors have rolled out “a whole host of free training and education programs.” As these programs are virtual, CIOs are encouraging their staff to attend these sessions with zero travel costs and registration fees.
Likewise, CIOs are using the time at home to hone their leadership, communication, and team engagement skills. CIOs have found their teams to be more productive, collaborative, and agile, with rising morale.
The third silver lining is the acceptance and integration of new tools into business workflows. Many of these changes were a necessity due to operational dislocations, but these new tools are “driving new levels of productivity and employee self-service across the enterprise.”
The work from home experience has also served as a “future of work lab” which forced executives and managers to “rethink business processes.” This rethinking has “driven a wave of innovation internally” and let management observe how a remote workforce behaves. This forced experiment has helped CIOs “map out a vision of what the future of work should really look like at their companies.”
Finally, the pandemic has encouraged CIOs to test and revise their business continuity plans and enhance security tools and protocols, readying the firm for the next crisis.
Gillenwater described the current situation as a balance between navigating COVID and growth-focused initiatives:
Evolving work-from-home into a long-term roadmap for the future-of-work
Enabling security everywhere and agile/mobile/digital/cloud everything
Scenario and business continuity planning, in an attempt to plan for future changes and challenges
Accelerating digital initiatives, at a pace that many say they’ve never seen before
Cost cuts/expense management, an inevitability in an economically trying time
Reprioritization and refocusing of IT investments and projects
eCommerce, as part of the rush to digitize
Innovation, to identify and capitalize on future opportunities
Scott Brinker and ChiefMartec published their annual eye chart of MarTech companies. The list grew another 13.6% to 8,000 companies. However, the attrition rate was 8.7% as one in twelve companies on last year’s list were either acquired or folded.
The Data category grew by 25.5% to 1,258 companies. Within the data grouping, Governance, Compliance, and Privacy rose 68%. Other sub-segments with rapid growth include Conversational Marketing and Chat (up 70%), Projects and Workflow (up 41%), Print Advertising and Promotion (up 35%), and Video Marketing (up 26%).
While MarTech continues to expand, Brinker contends that the industry has a long-tail with one to two dozen platforms that “dominate global market share.” These are followed by a few hundred category leaders, each with tens or hundreds of millions of dollars in revenue.
Brinker argues that MarTech has evolved from suites to platform ecosystems that look to leverage the capabilities of long-tail builders and entrepreneurs, providing niche solutions integrated into their platforms. “The stability of a major platform as the backbone of a marketing stack augmented with a set of specialized apps designed to plug deeply into that platform is a powerful combination. A “point solution” — which used to be a negative label — isn’t a point solution any more when it seamlessly integrates into your primary platform. It becomes part of the fabric of your stack. Literally: it’s a feature, not a bug.”
“At the same time, these characteristics give long-tail Martech businesses a certain degree of robustness,” continued Brinker. “By integrating deeply with a major platform, they overcome buyer objections to unintegrated software. They tap network effects with other integrated apps that can benefit from each other’s data and services. And they can focus their marketing and sales energies toward a well-defined target audience — customers of that platform — often through online marketplaces run expressly for that purpose.”
This logic is being replicated in newer categories such as Sales Engagement. Outreach and SalesLoft have offered partner ecosystems for several years that augment their capabilities and provide flexibility to their offerings. Just as Salesforce has acquired companies to extend its capabilities, SalesLoft has acquired partners (NoteNinja and Costello) to extend core capabilities. Smaller vendors may not offer formal app directories, but usually partner with a few best-of-breed vendors in various categories (e.g. LinkedIn SNAP, Vidyard, Drift, Zoominfo).
Now, this year’s data was collected before the coronavirus pandemic exploded globally in March 2020. The elephant-in-the-room question, of course, is what impact will this crisis have on the Martech industry? What will the Martech landscape look like in 2021?
Scott Brinker, ChiefMartec
Brinker sees the pandemic as “more of a short-term hit than a long-term death” as “it’s going to be a tough time for their customers,” resulting in a culling of weaker vendors. Certainly, business spending will be reduced due to economic uncertainty. Brinker also cautions that marketing operations will be stretched thin, dealing with crisis operations, and a reduction in VC funding will increase the perceived vendor risk for startups.
But the pandemic is not entirely negative for MarTech companies. On the positive side, businesses will “lean in to digital engagement / transformation,” focus on performance marketing, and benefit lower-priced products tied to platform ecosystems.
“The world is going to continue to become more digital. If anything, this crisis will accelerate the motivation for firms to embrace digital operations and digital customer experience. And that’s where MarTech thrives.”
Finally, Brinker noted market analysis conducted by Luma Partners. While the S&P 500 was down 25% in Q1, MarTech public companies were down only 8%. This mild decline is an indicator that MarTech is viewed more favorably by the market than other categories (and far better than AdTech, which declined 32%).
There are a number of indicators signaling a slowdown
in both the general economy and technology products and services:
The Gartner CMO Spend Survey showed a drop in marketing spend as a percentage of overall spend from 11.2% in 2018 to 10.5% this year. The peak in marketing spend was in 2016 (12.1%). The data is based upon a survey of 340 North American and UK marketing leaders. However, 61% of marketers anticipate a rebound in 2020. “While we’re not yet witnessing a precipitous drop in budgets, this year’s downtick presents a counterintuitive scenario,” commented Gartner’s VP of the Marketing practice, Ewan McIntyre. “You could call this confidence in the face of adversity. Or you could call it hubris.”
MarTech budgets fell 3% to 26% this year.
The Gartner 2Q19 Global Talent Monitor indicated growing concern about the job market with fewer employees looking to change jobs. 53% of US employees are intending to stay put and only 12.5% are actively looking for other positions. The US actively looking rate dropped in half in Q2 and the percent looking to stay put rose ten points. “Over the previous several years, the clear story within the U.S. has been a robust economy, tight labor market and plenty of opportunities for growth and improvement from the employee perspective,” said Brian Kropp, chief of research for the Gartner HR practice. “With this quarter-over-quarter increase in intent to stay, we are now seeing a shift as employees hunker down, indicating concerns around available job opportunities and potential weakness in the labor market.”
Gartner also noted a 2.4% decrease in global business confidence amongst employees and an increasing willingness of US employees to go “above and beyond the call of duty at their jobs.” According to Kropp, “Workers appear to be putting more time and effort into their current positions with the hopes of solidifying their roles in case of a change in the economy. This situation creates an opportunity for organizations to invest in internal training programs that capture this employee commitment to build a stronger, more productive workforce.”
Trump’s Tariff War is proving more difficult to win than he anticipated, resulting in inflationary pressures in the US alongside harm to the industrial and agricultural sectors. Tariff rates are expected to increase at the end of the year.
Brexit remains a big question mark with dates, agreements, and new UK elections changing almost every day.
The US and UK governments are both very unpopular with Trump facing Impeachment hearings and Boris Johnson preparing for an election.
While the US unemployment rate is at a historical low point (3.6%), the economy only added 128,000 non-farm jobs last month and 130,000 per month this year, well below the 223,000 jobs added each month in 2018.
The preliminary US GDP Q3 growth rate came in at 1.9% compared to 2.9% in 2018.
US Hiring has slowed to its lowest rate in seven years. A survey of economists by the National Association of Business Economists found that only one in five of their firms grew their headcount in Q3 down from one in three in Q2. Capital equipment purchasing is at a five-year low and fewer firms are offering pay raises. “The U.S. economy appears to be slowing, and respondents expect still slower growth over the next 12 months,” said Constance Hunter, NABE president and chief economist at KPMG.
The NABE also reported slowing sales with only 39% reporting sales growth in Q3 compared to 61% a year ago.
If the US economy tips into a recession, there is little room for fiscal or monetary policy to slow a recession. The Federal Funds rate (1.75% following three cuts this year) is historically low for an economy at 3.6% unemployment and the Federal deficit provides little room for expansionary fiscal policy. Trump lowered personal and corporate tax rates when the economy was strong instead of waiting for a recession.
Gartner forecasted 3.2% growth in global IT spend in 2019, with turnover hitting $3.8 trillion. Growth will be driven by Enterprise Software (up 8.5% this year and 8.2% next year) and IT Services (up 4.7% this year and 4.8% next year). Slower growth segments include Devices (1.6% growth in 2019), Communications Services (up 1.3% in 2019), and Data Center Systems (growing in 2019 but retreating in 2020).
“Despite uncertainty fueled by recession rumors, Brexit, and trade wars and tariffs, the likely scenario for IT spending in 2019 is growth,” said John-David Lovelock, research VP at Gartner. “However, there are a lot of dynamic changes happening in regards to which segments will be driving growth in the future. Spending is moving from saturated segments such as mobile phones, PCs and on-premises data center infrastructure to cloud services and Internet of Things (IoT) devices. IoT devices, in particular, are starting to pick up the slack from devices. Where the devices segment is saturated, IoT is not.”
“IT is no longer just a platform that enables organizations to run their business on. It is becoming the engine that moves the business. As digital business and digital business ecosystems move forward, IT will be the thing that binds the business together.”
David Lovelock, Gartner Research VP
The
shift to the cloud and SaaS will continue to benefit Enterprise Software spend
with global expenditures hitting $466 billion in 2020.
“Cloud
shift is not just about cloud. As organizations pursue new IT
architectures and operating philosophies, they put in place a foundation for
new opportunities in digital business, including next-generation IT solutions
such as the Internet of Things (IoT),” said VP Ed Anderson earlier this year.
“Organizations embracing dynamic, cloud-based operating models position
themselves for cost optimization and increased competitiveness.”
Lovelock
warned that companies are failing to upskill their internal staff quickly
enough to support newer technologies such as IoT, AI, machine learning, data
science, APIs and services platform design. Gartner was concerned that
“nearly half” of the IT workforce is in “urgent need” of upskilling to “support
their digital business initiatives.” The risk for businesses is that
emerging technologies “are changing faster than we’ve ever seen before.”
LinkedIn told CNBC that the top three tech skills in demand are artificial intelligence, big data, and cloud computing. However, they noted that many technology skills have a market value of only six years, so soft skills such as critical thinking, creativity, and problem-solving should also be honed. In order for workers to keep up, they should avail themselves of courses from LinkedIn Learning or Massive Open Online Courses (MOOCs).
“It’s important for companies to
continue to invest in their people so that they are upskilling and reskilling
their people to keep up with the roles that are in demand,” said Feon Ang,
LinkedIn Vice President for Talent and Learning Solutions, Asia Pacific.
“But, at the same time, people need to continue to invest in themselves
and have a growth mindset,” said Ang.
At last month’s Tenbound Conference Mark Dean, Head of Sales Development-Americas for LinkedIn, noted that soft skills are becoming increasingly critical for employees. LinkedIn research found that 57% of leaders weighed soft skills over hard skills. In demand skills include creativity, persuasion, and collaboration. In short, he asked, “Can they tell a story?”
“In the age of continuous change, global competition, and the use of AI, the employees who will become leaders and visionaries are the ones who can communicate effectively and create connection within the organization. It is only when employees have a sense of shared purpose and connection that they will do what it takes to help the organization succeed. The best way to build this connection is through authenticity, vulnerability, and storytelling. Soft, human-focused skills are the currency of the future. Employees need to take it upon themselves to grow and learn on a continual basis, whether it’s finding a mentor or continually investing in their growth to hone these skills.”
Lynne Levy of Arena Consulting
For Salesforce skills, there is Trailhead which the firm promotes at both public forums and on earnings calls.
Gartner forecasted continued growth of global public cloud services. The analyst firm projected 17.5% growth in 2019 to $214.3 billion. The fastest growth rate will be in Infrastructure as a Service which will jump 27.5% to $38.9 billion. Platform as a Service is expected to rise by 21.8% this year.
“Cloud
services are definitely shaking up the industry,” said Gartner Research VP Sid
Nag. “At Gartner, we know of no vendor or service provider today whose
business model offerings and revenue growth are not influenced by the
increasing adoption of cloud-first strategies in organizations. What we
see now is only the beginning, though. Through 2022, Gartner projects the
market size and growth of the cloud services industry at nearly three time the
growth of overall IT services.”
Gartner
research found that a third of organizations listed cloud investments as a top
three investment priority. Thirty percent of technology providers new
software investments are shifting from cloud-first to cloud only. Thus,
SaaS and subscription cloud models will continue to replace license-based
software sales.
MarTech growth rate chart courtesy of Scott Brinker and Chief Martech
Scott Brinker published his 2019 Chief Martech eye chart and it now spans 7,040 companies, up 211 since last year. While the industry continues to grow, the rate of growth appears to have moderated. Between 2014 and 2018, the industry was adding over 1,000 companies each year with the biggest jump for the 2018 chart (1,800).
“That’s not
so much a slowing down as a flattening out, a plateau,” said Brinker. “At
face value, it would seem that, indeed, we have achieved ‘peak martech.’ (pause
for dramatic effect)”
While
industry growth may have plateaued, Brinker admitted that 7,040 significantly
underestimates the total number of Martech firms and joked that he may have hit
“peak martech landscape.” Brinker noted five areas where his chart is
underweighted:
Regionally – When comparing to national MarTech landscapes, Brinker spotted hundreds of companies on the UK, Canadian, Chinese, German, Swedish, and Finnish country charts that were absent on the 2019 Chief Martech chart.
Vertical – Likewise, verticalized solutions are also underrepresented.
Apps built for specific MarTech platform ecosystems
Apps built by services companies (but packaged as products)
Apps built with low-code/no-code citizen developer platforms
“Each of
these trends — the growth of platform ecosystems, the blending of software and
services businesses, and the rise of citizen developer platforms — are birthing
whole new galaxies of martech apps.
The major
marketing suites have all embraced becoming true marketing platforms, with ever
more open APIs and official marketplaces for third-party apps.”
Brinker
lists Salesforce, Oracle, Adobe, Microsoft, and G Suite amongst the platform
ecosystems, but one would also include browser extensions, mobile apps, and
sales engagement platforms (technically, SalesTech, but there is a fair amount
of overlap between MarTech and SalesTech these days) to the list. Brinker
noted that WordPress has 54,480 plugins.
Audience / Marketing Data & Data Enhancement (2018 MarTech Landscape)
Many of the
DaaS and Sales Intelligence vendors covered in this newsletter are amongst the
204 vendors listed in the Audience / Marketing Data & Data Enrichment
category and the 457 vendors listed in the Sales Automation Enablement & Intelligence
grouping.


