B2B Data and Intelligence vendor LeadGenius announced its expansion into the APAC region with “substantial” coverage of Japan, South Korea, Australia, and India. The firm also touts “emerging” coverage of China, Vietnam, and Uzbekistan. Simultaneously, the firm announced its new LeadGenius Plays and Rapid Enrich offerings.
“By leveraging top-performing campaigns from exceptional marketers, we help businesses launch complex data requests in seconds,” said VP of Sales and Customer Success Zeb Couch. “We are continuing to work with our clients around the world to build global B2B data aimed at increasing growth through custom signals and account insights. With over 80% of B2B data undiscovered or underutilized, we want to give our clients every tool possible for targeting and differentiation.”
LeadGenius Plays simplifies custom data campaigns and look-a-like audiences based on non-standard data characteristics. Plays also enriches files and appends missing fields.
LeadGenius employs artificial intelligence, robotic process automation (RPA), human intelligence, and curation when collecting its data.
LeadGenius Campaign Plays
LeadGenius also announced its Rapid Enrich real-time DaaS product this week, with coverage of enterprise, SMB, and global data.
“In the fast-paced world of B2B data, the need for a solution that offers agility, precision, and comprehensive insights was evident,” stated LeadGenius CEO Mark Godley. “With the unveiling of Rapid Enrich, we are setting a new standard for data enrichment technology, enabling our clients to stay ahead in an increasingly competitive landscape. We are thrilled to introduce Rapid Enrich as our latest innovation in providing agile, comprehensive, and industry-leading data solutions. Our relentless pursuit of excellence and commitment to our clients’ success remains our guiding principles as we continuously push the boundaries of what’s possible in the B2B data sector.”
LeadGenius emphasized its data security and privacy management. Rapid Enrich includes “contractual assurances of responsible data handling, coupled with transparent audit trails that enable businesses to maintain an unquestionable record of their data management activities.”
If a US public company, look at its 10-K (annual report). Firms generally discuss their competitors. You can locate the 10-K on a company’s investor site, through sales intelligence vendors, or free Edgar sites.
If a private company, look at Owler, a free site (See below). This is crowdsourced so may include firms that aren’t true competitors.
Owler competitor lists are gathered through social voting.
Look at sales intelligence services such as D&B Hoovers or InsideView. Hoover’s competitors are editorially generated and include top three flags (see below)
D&B Hoover’s competitor lists are gathered by a team of researchers.
Within IT, look at Forrester Wave reports. Another option is technology category searches in PE/VC databases such as DataFox, Crunchbase, Pitchbook, or CB Insights. Keep in mind that companies within the same segment may not be competitors, but partners, customers, etc.
Many industries have industry specific market research that includes competitors. A few general market research firms also provide competitors (e.g. MarketLine, Euromonitor, Global Data, and Freedonia). Top Competitors are also available in IBISWorld, Vertical IQ, and First Research.
Zoominfo and a few other vendors identify similar companies based upon proximity in articles. This finds competitors, but also customers and partners so should be carefully reviewed.
For new technologies or industries, D&B Hoovers offers Conceptual Search which identify companies associated with key phrases (e.g. Marcellus Shale, Obamacare). This is more of an associated companies list and will identify firms in a topical ecosystem. For example, “Harry Potter” identifies studios, publishers, toy makers, theme parks, and thematic tours. (See example below of conceptual search on Marcellus Shale). Conceptual Search lists may be refined by standard prospecting filters such as industry, geography, and size.
D&B Hoover’s Conceptual Search looks for companies associated with specific phrases.
If none of these work, use peer list searches (industry code lists) or keyword searches in sales intelligence vendors. If cost is a concern, go to your public library and see if they have ReferenceUSA, AtoZDatabases, or Mergent Online. Each of these allows you to build peer lists based on industry codes, company size, and geography. If you need help, ask for the business or reference librarian to assist.
Mmojo’s prospecting module supports both traditional prospecting and ABM list cloning. The Build a List User Interface is straightforward with filtering by
Location: State, City, ZIP
Company Name
Company Attribute: Public/Private/Government, HQ/Sub/Branch
Size: Revenue, Employees
Technology
Industry: Industry Keyword, SIC
Contacts: Function, Level, Keyword
Indicators: Home Office, Woman Led, Minority Led, Franchise
Type-ahead suggestions help with quickly entering cities. technologies, industry, and job functions/levels.
Missing geographic selects included counties, MSAs, ZIP Ranges, Email and Direct Dial Availability. The inability to easily refine by location may be a hindrance to SMB sales.
The Industry selects are by keyword and SIC code, but the keyword search which supports typeahead suggest is sluggish. NAICS codes are coming next month.
Mmojo offers a matrix for quickly selecting job functions and levels.
A nice feature is the ability to quickly select contacts by function (Sales, Marketing, Engineering, IT/IS, HR, Finance, Operations, Planning) and Level by clicking or dragging the clicked mouse across a grid (see image on right). Users can also enter keywords, but the list was mostly high-level titles and general functions. Missing were key roles such as purchasing, sales operations, accounts receivable, accounts payable, security (except CISO), and compliance (except CCO).
Another welcome feature is the ability to save multi-variable filters allowing marketers to store territories or industry segments for quick recall.
Previously uploaded or built lists may be used for list suppression (e.g. exclude current customers and prospects) or as a constraint list (e.g. subsetting of a current list for targeting). The system also maintains a Master List for this purpose.
When prospecting, marketers can grab a random subset of the list for a campaign or for forwarding directly to sales reps.
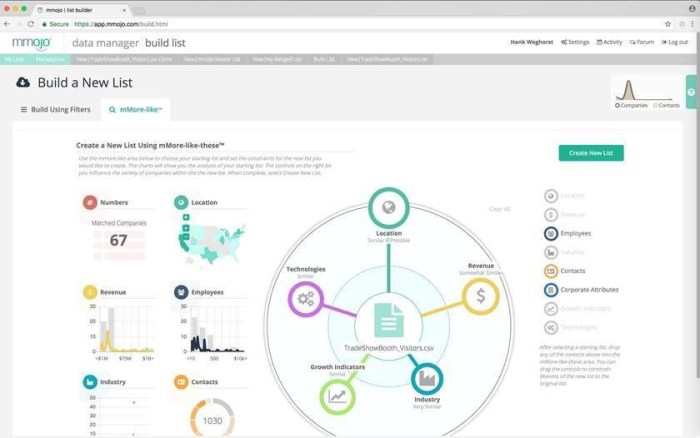
Lists can also be used to find mMore-like-these cloned companies. The peer feature allows users to define the relevant variables and weights to be assigned to them. Thus, a regional tradeshow list can be used as a seed file for additional prospects, but with the location variables relaxed; additional variables (e.g. deployed technology, growth indicators, corporate attributes) can then be assigned corresponding weights. This feature is easily managed via a drag-and-drop tool and visual indicators. As a segmentation analysis is also displayed, marketers can analyze the seed file as they adjust the selection criteria and weights.
I had one significant concern: the workflow from building a list to viewing it is not clear and is likely to frustrate trialers and new users. Nevertheless, the user interface is otherwise straightforward and the dynamic segmentation (see left side of top image) is beautifully rendered and informative.
Sales and marketing intelligence vendor InsideView launched their Apex “go-to-market decision engine.” The new product combines InsideView and CRM data to assist with analyzing new market entry, identifying a firm’s Ideal Customer Profile (ICP), and assessing its Total Addressable Market (TAM).
“Smart B2B companies today are asking these questions: ‘Who are my best customers?’, ‘What are the new geographies and industries where I can expand?’, and ‘Are we going after the right customers and the right revenue?’,” said InsideView CEO Umberto Milletti. “We realized we had the technology, expertise, and data to help companies answer these questions quickly and with confidence so they never miss an opportunity. Business strategy shouldn’t be based on gut and guessing. And it shouldn’t require cumbersome data analysis. InsideView Apex uses cutting-edge technology and the best possible data so you can make the right decisions for your business.”
Go to market planning features include an ICP wizard, new/adjacent visualization tools with “what if” targeting analysis, TAM and market penetration analysis, new account and lead identification, and exporting of new ABM prospects to CRMs and MAPs.
“Revenue teams can use InsideView Apex to visualize performance against target segments in real time to optimize for success and focus resources on the targets with highest potential,” said Joe Andrews, VP of Product and Solution Marketing. “Marketing can see performance indicators at each stage of the funnel as leads convert to opportunities and won deals. Sales ops can identify where leads or opportunities may be getting stuck to course correct in real time.”
The Apex account score is based on an AI algorithm which correlates attributes from deep company profiles that are proprietary to the InsideView Platform. The account score is maintained and updated dynamically within Apex as customer ICP lists change. However, the account score is not currently pushed to CRM or InsideView for Sales.
If customers have also licensed InsideView Sales and Enrich products, ABM accounts are tagged.
Other visualization tools include a five-quarter historical view; market segmentation of leads, opportunities, and wins; and account whitespace (market penetration) analytics.
InsideView Apex Funnel Analysis Dashboard
Apex integrates with Salesforce, MS Dynamics, Eloqua (Oracle Marketing), and Marketo.
Apex is licensed as an annual subscription and is priced in tiers based on company size which serves as a proxy for the number of market segments being targeted.
Apex is not the first tool in this category (e.g. D&B DataVision and DiscoverOrg AccountView), but it is emblematic of the expansion of sales intelligence vendors into market intelligence and strategic planning. When I started GZ Consulting six years ago, the sales intelligence firms were wary of entering the marketing realm, but the top sales intelligence firms are now offering ICP/TAM tools, marketing automation connectors, segmentation analysis, look-a-like prospecting, and data enrichment tools. This shift goes hand-in-hand with the blurring of the lines between sales and marketing. For example, sales engagement platforms provide cadence, analytics, and email marketing tools for sales reps alongside dialers and sales coaching. We are also seeing visitor intelligence and intent data being displayed within CRMs.
“Most B2B companies perform go-to-market planning and analysis in product silos and often fail to involve sales and marketing teams early in the process – those who must execute the strategy. Planning is a slow, manual process, based on limited information. Most firms have few ways to measure market performance reliably against strategy, making it nearly impossible to course correct in real time. It’s time to change this.”
Forrester Principal Analyst Laura Ramos
A 2018 InsideView survey of 500 American sales and marketing professionals found that TAM measurement was non-existent (25%) or ad hoc (28%) at surveyed organizations. Only 23% of respondents work at firms that regularly evaluate Target Demand. The remaining 24% of firms perform Target Demand analysis annually.
“All of the efficient and creative demand generation in the world will be wasted if the targeting is off,” wrote the firm in their 2018 Sales and Marketing Alignment report. “The shotgun approach to sales and marketing no longer works. There’s too much noise in the market and in prospects’ inboxes. The only way to stand out is to know who you’re targeting, and why and when they buy, and it can’t be done effectively unless both sales and marketing buy in it. Developing an ideal customer profile (ICP) and using it to determine your total addressable market (TAM) will help sales and marketing know exactly who to target, why they need your products, and when they need them.”
Dun & Bradstreet, which has had a series of major product announcements over the past few weeks (the Avention acquisition, rebranding of its OneSource platform as D&B Hoovers, a Beneficial Ownership product), has quietly added powerful new functionality to their Workbench Data Optimizer platform. The new Profile capability features an automated profile builder, Total Addressable Market (TAM) analysis, and look-a-like prospecting based upon the Workbench profiles.
The new functionality helps marketers evaluate the size of targetable sub-markets, identify audiences with a high propensity to purchase, discover overlooked whitespace opportunities, and target new accounts and contacts. According to Alex Schwarm, Sr. Director of Marketing Analytics Products, “Profile enables our Workbench customers to begin to use data-driven, ABM-oriented Profiles based on their successful sales. These automated analytics allow you to quickly and easily identify the best whitespace opportunities and characteristics of your target audiences including those with the highest propensity to buy – no data scientist needed.”
NetProspex WorkBench Value Proposition
Profile is a black-box analytics engine which clusters customer files without biases. Marketers upload a file of their customers’ data for a specific product or product family. Workbench standardizes, de-duplicates, and verifies the input file; matches and enriches it with Dun & Bradstreet’s WorldBase firmographics; and then provides segmentation and file health analysis. The Profile module identifies between two and eight distinct segments containing similar companies across multiple dimensions. The user can define the number of profiles or the system can automatically identify the optimal number of profiles based on the variation of the customer file. The marketer is not required to define the key segmentation variables. Instead, the system automatically performs affinity clustering (my term) to build the segments. Execution time is typically 5 to 10 minutes.
The results are displayed on a downloadable dashboard that provides a side-by-side firmographic analysis of the clusters. Results include company size, ownership (e.g. parent, branch), primary industries, cluster size, and average deal size (if revenue figures are also shared with Dun & Bradstreet). Thus, the system may identify segments with a lower average deal size but a larger number of prospects alongside clusters containing top customers with high average deal size but a small number of targetable opportunities.
Portion of Workbench Profile summary report
While Dun & Bradstreet does not use the term “Ideal Customer Profile” (ICP) the system is basically identifying the attributes of a customer’s ICP, determining the average deal size, and sizing the overall market opportunity.
Dun & Bradstreet has two major assets in performing TAM analysis: The WorldBase file of global companies and trust built up over 170 years of credit research. WorldBase provides them with a consistent, global file of 260 million active and inactive companies for credit and supplier risk research, sales intelligence, and B2B marketing. The file includes broad global company linkages, corporate and location sizing, industry coding, Tradestyles, and D-U-N-S Numbers (the de facto global company numbering system). This intelligence provides the core reference file against which market sizing can be performed. But TAM analysis requires customer level revenue information against which company counts can be converted to market sizes. And here is where a strong credit analysis brand helps build confidence amongst marketers to share company revenue data. While they will be reluctant to share revenue details with most vendors, firms have been sharing private financial details with Dun & Bradstreet over the better part of two centuries.
Marketers can then take any of the profiles and immediately identify net-new similar companies as well as net-new contacts. The system also sizes potential target market audiences that can be reached programmatically through their Audience Solutions group.
While prospect scoring based upon these definitions is not yet supported, that is a likely future offering for the platform. Profile, along with a set of predictive scores and paired with D&B Hoovers’ business signals, represents a toe in the water of the predictive analytics space.